
The Numbers Know Before Draft Night
Net Wins NBA Draft Preview

Every draft season, front offices argue over the same sliver of prospects at the top. Scouts debate measurables. Agents spin narratives. But beneath the noise, the box score has been quietly keeping score all year, and when you distill it into a single number, the picture is surprisingly clear.
Net Wins measures how many wins above or below average a player’s individual production accounts for, calibrated against his own team’s pace of winning and losing. A high number means the player’s output (points, rebounds, assists, blocks, steals, relative to turnovers and missed shots) maps tightly onto team success. A low number doesn’t mean a player is bad; it means the data alone can’t yet justify the projection.
Personal foul data was unavailable at the team level for this model run, which means the Negative Actions denominator is slightly underweighted. Interpret the absolute values accordingly, but the relative rankings hold.
These numbers have been updated from the initial run earlier this spring. The rankings shifted more than expected.
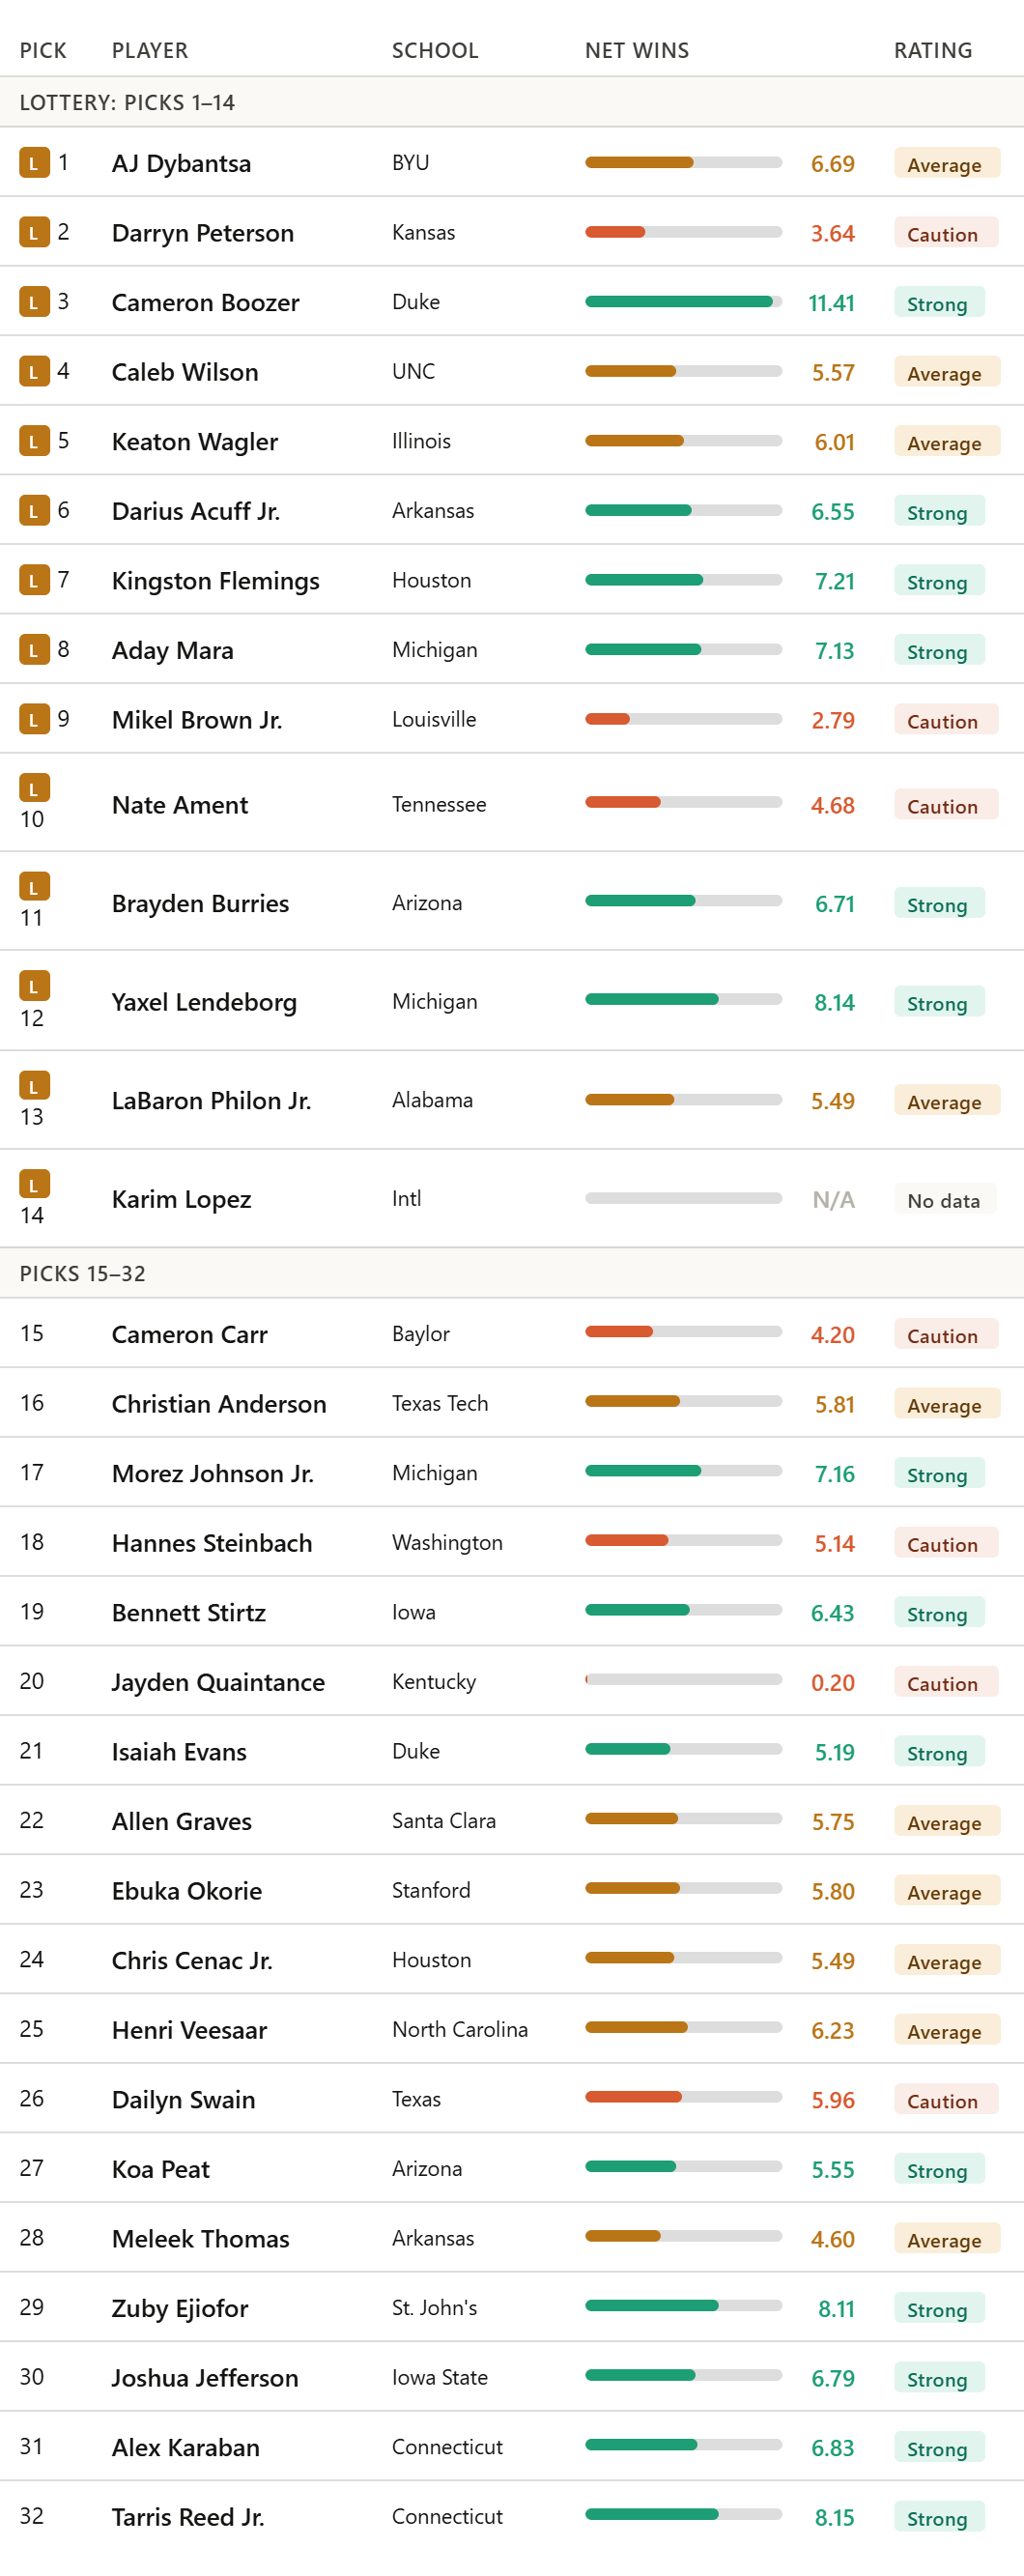
Cameron Boozer’s updated number is 11.41. The previous run had him at 8.59, which was already the highest mark in the class by a wide margin. The gap between Boozer and every other prospect has widened. Playing alongside his twin brother Cayden at Duke, the younger Boozer has been a monster contributor on a 35-win team, and the updated metrics make a case no one else in this draft can currently match on pure production.
AJ Dybantsa goes first overall in most boards and his number moved significantly from 3.35 to 6.69, a jump of more than three wins over the updated data. He’s now producing like a legitimate lottery player by the formula. But the gap to Boozer at the top is still 4.72 net wins. The consensus has Dybantsa as the better prospect for reasons the box score doesn’t fully capture: age, athleticism, upside, ceiling. Those are real factors. The number just hasn’t caught up to the hype, and at this point in the season it probably won’t.
The UConn pipeline stands out in the updated data. Tarris Reed Jr. at 8.15 and Alex Karaban at 6.83 are both posting numbers that most lottery picks don’t reach, and both are projected well outside the lottery. Reed is sliding to 32 in most boards despite leading nearly all non-Boozer prospects in the formula. Karaban at 6.83 is producing at the same level as several players going in the top 10. UConn’s 34-win team provided a legitimate calibration environment, and these two were genuine contributors to it.
Zuby Ejiofor at 8.11 is the other late-board player with a number that demands attention. St. John’s was one of the better teams in the country at 30-7, and Ejiofor’s production reflects that. His projection at 29 puts him in the same territory as the UConn duo, players the market is discounting for reasons the formula doesn’t weigh.
The Michigan pipeline remains one of the class’s dominant stories. Yaxel Lendeborg (8.14), Morez Johnson Jr. (7.16), and Aday Mara (7.13) all updated above 7.0 on a 37-3 team. The original article noted the concentration of production from one program; the updated numbers confirm it. Lendeborg’s age (24) continues to be the reason boards discount him. The number itself 8.14 is the third-best in the class, behind only Boozer and Reed by a fraction.
Darryn Peterson’s number updated to 3.64, up from 1.98. The abbreviated Kansas season due to his reported health issues is still visible in the total, but the rate improved. His placement at pick 2 in most boards reflects projection on a player whose data remains incomplete. The formula measures the gap between what happened and what scouts believe will happen at the next level; for Peterson, that gap is wider than almost anyone else at the top.
Jayden Quaintance updated to 0.20 from 0.07, which is the closest thing to no change in the dataset. The knee injury that limited him at Kentucky is the full explanation. His pick 20 slot is an investment in physical tools and what scouts saw before the injury, not what the box score recorded this season. That’s a legitimate basis for drafting someone - the data just can’t evaluate it.
Bennett Stirtz at 6.43 is the number that moved most unexpectedly in the 15-25 range. The Iowa guard was at 3.15 in the initial run and nearly doubled. His pick 19 projection looks increasingly conservative against a number that matches Kingston Flemings (7.21, pick 7) and several other lottery selections.
Three players to watch
The Age Discount Yaxel Lendeborg - projected 12th, producing third-best in the class at 8.14. The Michigan win environment is legitimate, the number is legitimate, and his combine measurements 6’10” in shoes, 7’3.25” wingspan, 9’0.5” standing reach backed up the tape. The one thing boards can’t get past is age. At 24, front offices apply a steep discount regardless of production or measurables. Whether that discount is warranted remains the real debate.
The Asterisk Jayden Quaintance - pick 20 on most boards, 0.20 Net Wins. The number is incomplete data, not a talent verdict. Treat it accordingly.
The Hidden Value Tarris Reed Jr. - sliding to 32 in conventional boards, posting 8.15 Net Wins on a Connecticut squad that went 34-6. The model likes big men who anchor winning teams, and Reed was a genuine anchor. Back-to-back selections at picks 31 and 32 - Karaban at 6.83 and Reed at 8.15 represent the most undervalued one-two punch in the class by this measure.
Class summary
Of the 31 prospects with Net Wins data, 22 posted above 4.0 on the updated run a meaningful threshold for genuine contribution on a college team calibrated to wins. Twelve cleared 6.0, which is where the formula starts flagging a player as a reliable win-contributor rather than a volume accumulator on a middling team.
The back half of the first round is doing more statistical work than the front half can justify. Picks 29-32 - Ejiofor (8.11), Jefferson (6.79), Karaban (6.83), Reed (8.15) - average 7.47 net wins. Picks 1-4 - Dybantsa (6.69), Peterson (3.64), Boozer (11.41), Wilson (5.57) - average 6.83. The market is paying lottery money for lottery projection while the production is concentrated at the bottom of the first round.
That gap doesn’t mean the lottery picks are wrong. Projection, age, position, and athletic ceiling are real inputs that the formula doesn’t capture. But if you’re building a roster and you want the player most likely to contribute wins in year one, the formula says you’re better off watching the back end of this draft than the front.
© 2026 Will Fiore. Net Wins formula and all written content are original works. All rights reserved.
I actually have Net Wins data for all D1 which will be used for other cbb articles in the future.